Final projects -
abstracts and maps
Johns Hopkins
University
Environmental Sciences and Policy
Geographic Information
Systems
420.633.81 - Spring 2009
The
city of Portland, Oregon implements various
urban planning initiatives including an Urban Growth Boundary, zoning
restrictions, tax and land value incentives to direct residential and
commercial development within the metropolitan area and reduce urban
sprawl. The
analysis of residency
location and density, employment locations and landcover data for Multnomah,
Washington
and Clackamas counties provide statistical and geographic evidence that
these
planning initiatives significantly limit urban encroachment into
farmland and
forested areas while stimulating compact, infill development within
defined
urban areas. The
area within the Urban
Growth Boundary contains the majority of high-density census blocks and
employment centers, as well as experienced the greatest change in
landcover
from low intensity development to high intensity development. Academic and federal
agency research supports
the geographic analysis, but significant definition discrepancies, data
quality
and time constraints limit the ability to conclusively link specific
land
planning policies to development patterns.
The bog turtle (Clemmys muhlenbergii) is a state and
federally listed
endangered species. They are small, semi-aquatic turtles that
are long-lived and slow to reproduce. The bog turtle requires
an early successional environment with mucky soils and an open
canopy. Key bog turtle habitats are found in shallow wetland
areas in southeastern Pennsylvania. Urban sprawl and
development have led to the destruction of crucial habitat for this
species. Habitats are destroyed as wetlands are filled in for
construction, and genetic diversity is reduced as greenways that allow
adjoining population to mix are eliminated.
Conservation of bog turtle habitat is needed to reduce human impact on
the species and take steps toward preventing extinction. Key
environmental factors such canopy cover, soil type, proximity of
aquatic and terrestrial environments, presence of human activity and
water quality can be used to identify potential habitat.
Using different layers of data, it is possible to identify the
remaining potential habitat for the bog turtle with these key
characteristics. Using a geographic information system (GIS),
correlations can be found between the presence of bog turtles, suitable
habitat and these environmental factors.
The Pennsylvania Gap Analysis Program uses models to compare areas of
suitable habitat to those lands currently under conservation.
Mismatches are recognized as “gaps” in the current
conservation plan. Little suitable habitat remains for the
bog turtle, these areas must be identified quickly in order to enact a
habitat conservation plan and protect the bog turtle.
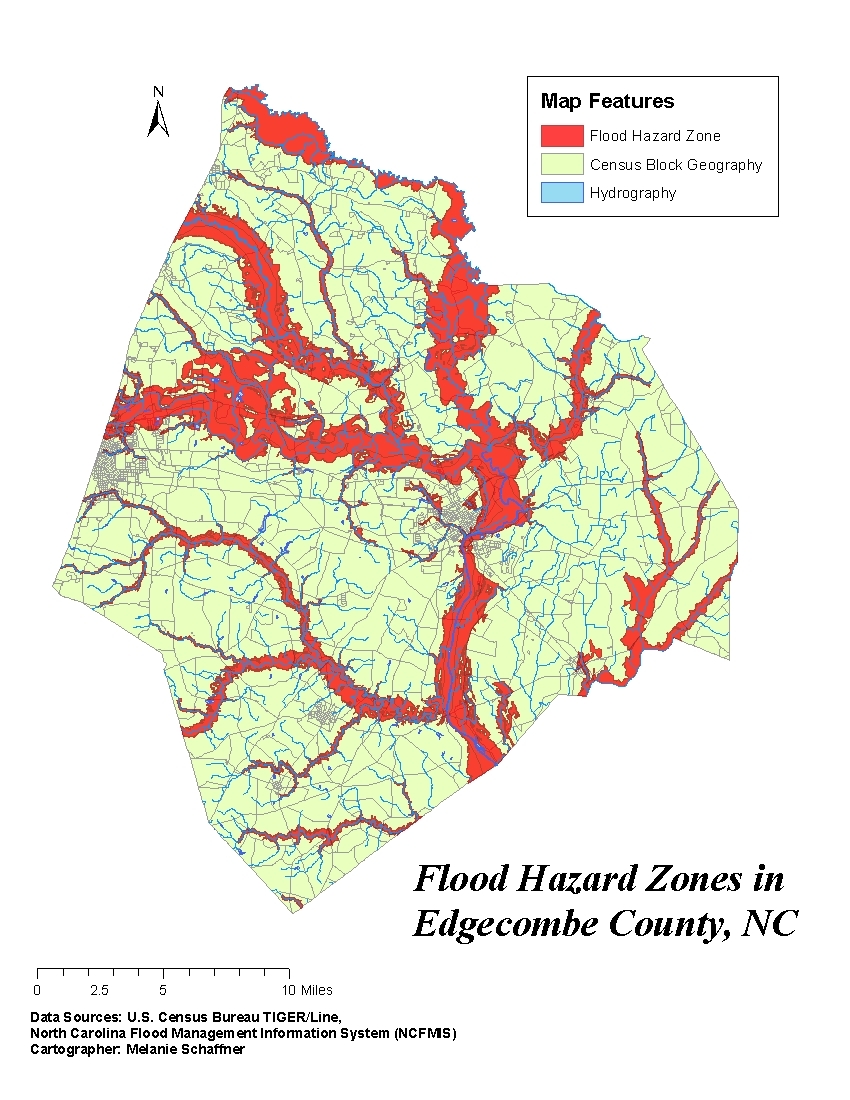
GIS methods were utilized to analyze population data in
relation to natural hazard risks in an attempt to identify factors that
could assist in developing more effective emergency response plans in
the case of a disaster. Specifically, data on flood hazard risks in a
region that has experienced historically catastrophic flooding was
combined with Census data on population demographics and socio-economic
status in the same location. Analysis focused in particular
on factors that have been identified as potential indicators
of social vulnerability, including age, gender, ethnicity, economic
status, household composition, language spoken at home, and
availability of transportation. Social vulnerability of certain
populations may affect their ability to respond in a crisis situation,
and to recover from a disaster; information gathered through this
analysis may assist in identifying ways to improve disaster response by
taking social vulnerability patterns into account during disaster
planning and mitigation activities.
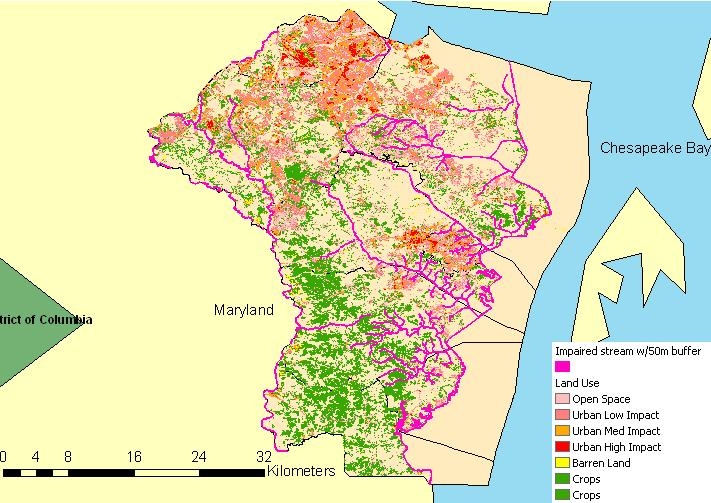
Numerous studies have indicated that wetlands and
waterways adjacent to urban areas are more heavily impaired than those
not in urban areas. (see Lyon and Adkins 1995 for an example) GIS can
be used to investigate the spatial correlation between urban land use
and impaired waterways through visual comparisons and statistical
analysis. This study tested the hypothesis that impaired
waterways are more often found adjacent to urban land use
areas. The study looked at two counties in Maryland,
Montgomery and Anne Arundel, to see if there were differences between
them. It also investigated how different ways of defining
wetlands and creating wetland data sets impacts the visual outcome.
Everglades National Park experienced a transformation of
land use in the 20th century from natural lands to agricultural and
urban development. The beginning of the 21st century promises a new
beginning with restoration of the Everglades hydrologic regime with the
Comprehensive Everglades Restoration Plan (CERP). Changes in land use
alter natural habitats physically and chemically, inviting foreign
species for proliferation. Population pressures force urban expansion
at the expense of the natural environment and the subsequent influx of
non-native vegetation with the potential to become invasive. This paper
focuses on the urban expansion of Miami and the probable increase in
invasive species in Everglades National Park. Three well-known invasive
tree species, Australian Pine (Casuarina sp.), Brazilian Pepper
(Schinus terebinthifolius), Melaleuca (Melaleuca quinquenervia) were
tracked by the South Florida Water Management District over a 12 year
period. When coupled with the increase in Miami’s population,
it is likely that there is a correlation; however, limited statistical
analysis cannot determine a strong correlation.
The state of Hawaii is home to 279 endangered plant
species. Natural and anthropogenic factors threaten the continued
survival of these species, many of which exist only in Hawaii. Using
threatened and endangered species richness and density data, natural
hazards data, invasive species data, and human encroachment and hazard
information, I will identify areas in need of protection and highlight
potentially catastrophic natural threats to those already conserved.
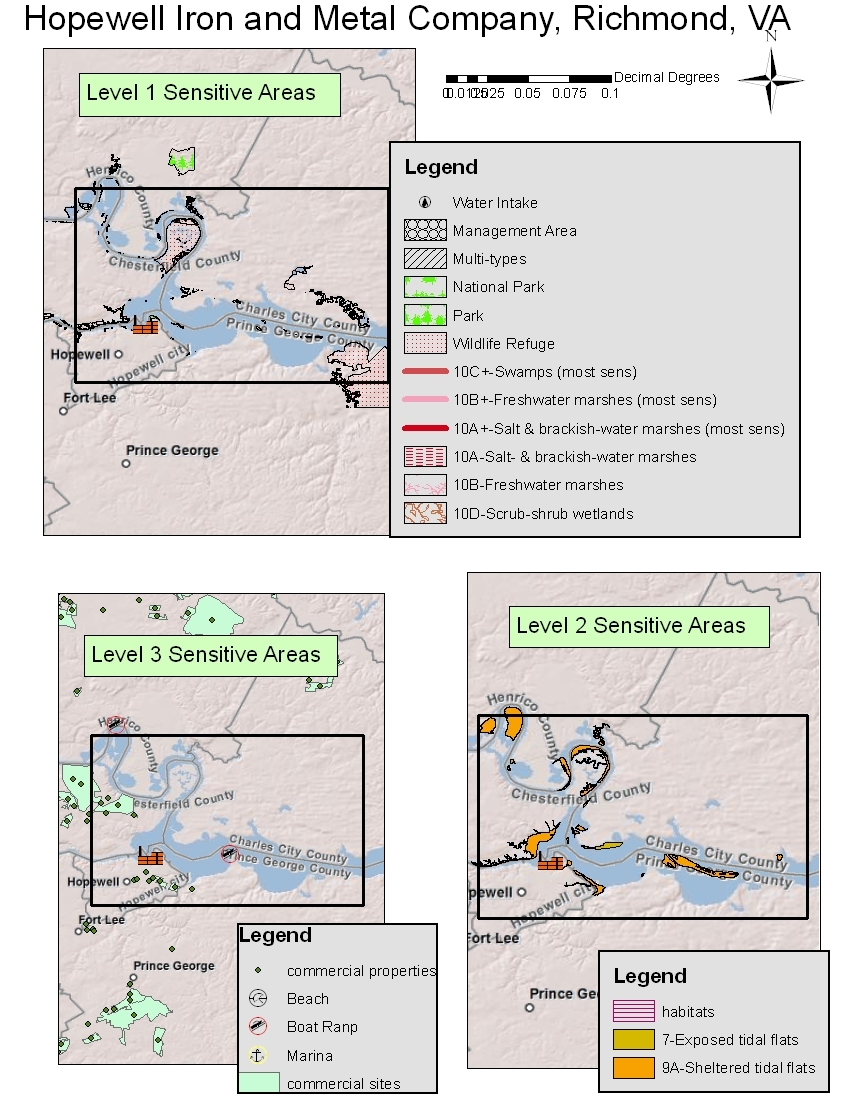
In the field of maritime pollution response, one of the
most
important measures of success is how effectively responders prevent and
mitigate damage to sensitive areas. Much of this success is a
direct result of preplanning efforts to designate and prioritize
sensitive areas within a given region before an incident has
occurred. In the event of a maritime pollution incident,
effective preplanning efforts aid responders in quickly and efficiently
protecting and cleaning up sensitive areas in order of
priority.
Unfortunately, these preplanning efforts have not yet taken place in
the Ports of Hampton Roads and Richmond, Virginia. This
mapping
project addresses this gap by clearly defining a sensitive area
prioritization hierarchy and applying it to existing public health and
safety factors, and natural and economic resources found in the study
area. The intention is that this prioritization hierarchy
will be
used during the initial response phase of a pollution incident, where
responders are working to both prevent sensitive areas from being
contaminated and mitigating further damage by deploying oil
boom.
Oil boom is a floating device used to contain oil on the surface of the
water. The project focused on five worst case pollution
scenarios
in the study area. For each of these scenarios, a Geographic
Information System (GIS) was used to survey existing sensitive area
response prioritization criteria. Maps were then generated
for
each sensitive area prioritization level (Level 1 – highest
sensitivity, Level 2 – higher sensitivity, and Level 3
–
high sensitivity) within the worst case scenario area to indicate
primary areas for protecting during the initial phase of a
response. Further preplanning needs are also addressed,
including
the application of these sensitive area maps to create booming
strategies and the use and accessibility of these maps through GIS to
facilitate faster responses to maritime pollution incidents.
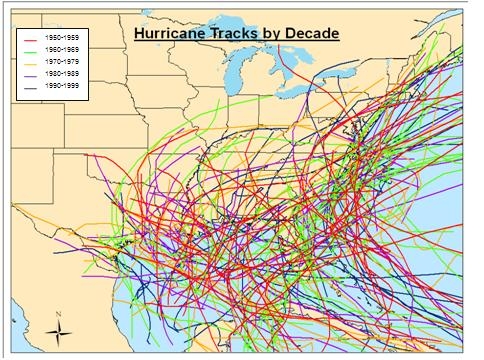
Recent attention has been focused on the numbers of
tropical
storms and hurricanes forming in the Atlantic Ocean and the Gulf of
Mexico. Studies have reported that the frequency of storms
has
doubled as a result of global climate change. Studies also
show
that more and more of the population of the United States is living
along the coast. This is putting more people at risk of being
affected by these storms. If the frequency of storms forming
has
doubled, has the number of storms impacting the U.S. also
increased? Do coastal areas that are frequently affected by
tropical storms and hurricanes experience smaller population growth
than other areas? This study will look at the number of
storms
that have impacted the U.S between 1950 and 1999. It will
also
look at the storm related damages and deaths for the same time
period. Census data will also be used from 1960 and 2000 to
determine how the population along the coast has changed. I
hypothesize that regions that are impacted more often by tropical
storms and hurricanes will have less of an increase in population than
regions that are impacted by storms less often.
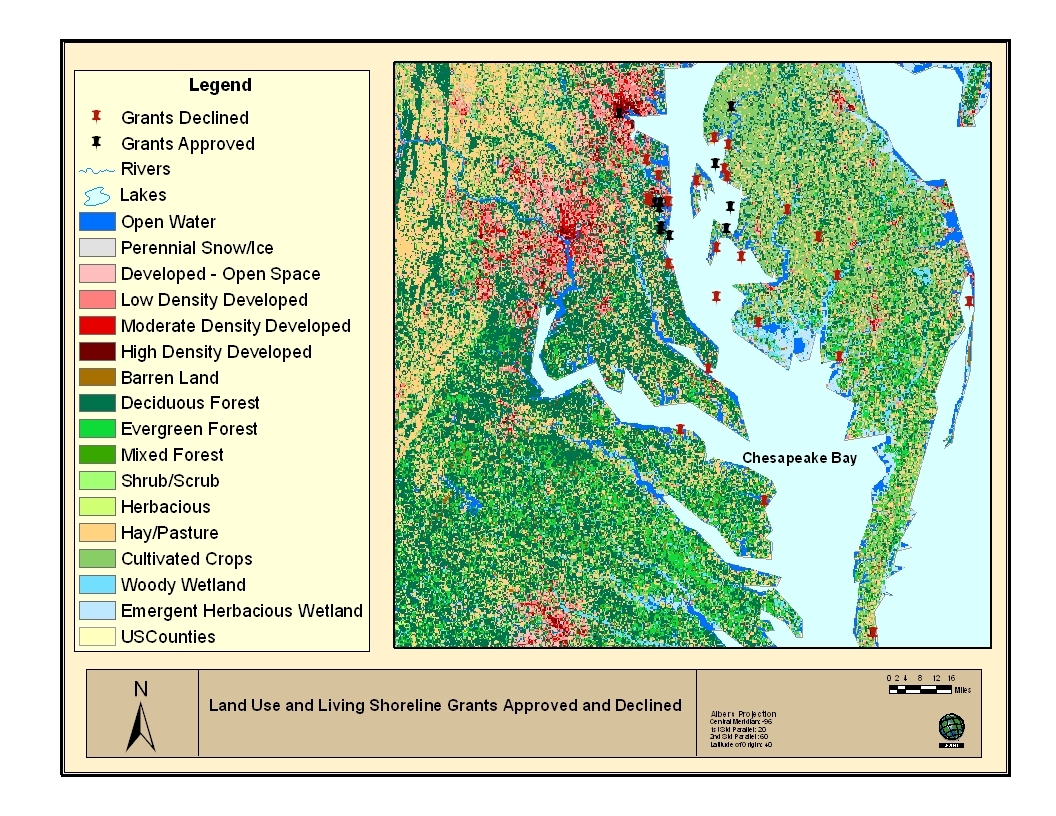
This study focuses on applying Geographic Information
System
(GIS) techniques to the monitoring and mapping of rapidly changing
conditions along shorelines in the Chesapeake Bay region of the State
of Maryland. The Chesapeake Bay Trust (Trust) is a non-profit grant
making organization that funds a variety of environmental projects that
promote awareness and participation in the restoration and protection
of the Chesapeake Bay and it’s tributaries. This GIS research
will be the first of its type to assess a specific type of project that
the Trust funds (Living Shorelines). This assessment and analysis will
focus on addressing the question: Has the Trust supported Living
Shoreline projects in appropriate areas and can we improve upon the
locations of projects that we choose to fund? Results of this GIS
analysis will inform the Trust about historic funding locations as well
as where future restoration dollars should be focused moving forward.
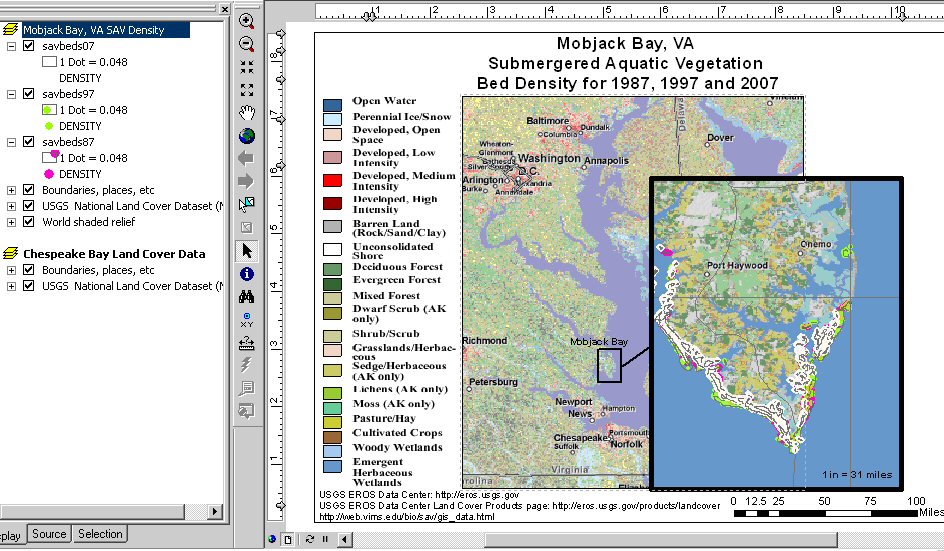
Vegetation found in Submerged Aquatic Vegetation (SAV)
beds
and tidal marshes play a key role in the ecological function of shallow
near shore ecosystems. Monitoring aquatic communities presents some
unique challenges that are not encountered during land based studies.
Technological advances in the last half century especially in the area
of remote sensing has made studying large scale near shore marine
habitats much easier (Silva et al., 2007). SAV beds are sensitive to
small changes thus making them good barometers (indicators) of water
quality; due to their immobility their health is directly correlated to
the water conditions in a given area at a given time. Both
anthropogenic and natural events are threatening the health of the
Chesapeake Bay. Increased urbanization in the bay watershed
places strain on tidal marshes and SAV beds from both point and
non-point sources. Development often eliminates or dramatically reduces
the health of tidal marshes and SAV beds in the surrounding area. Using
public data provided by Virginia Institute of Marine Science,
Chesapeake Bay Program, United States Geological Survey, and ArcGIS
this synthesis of data will study the connections between tidal marshes
and SAV coverage over time with respect to development.
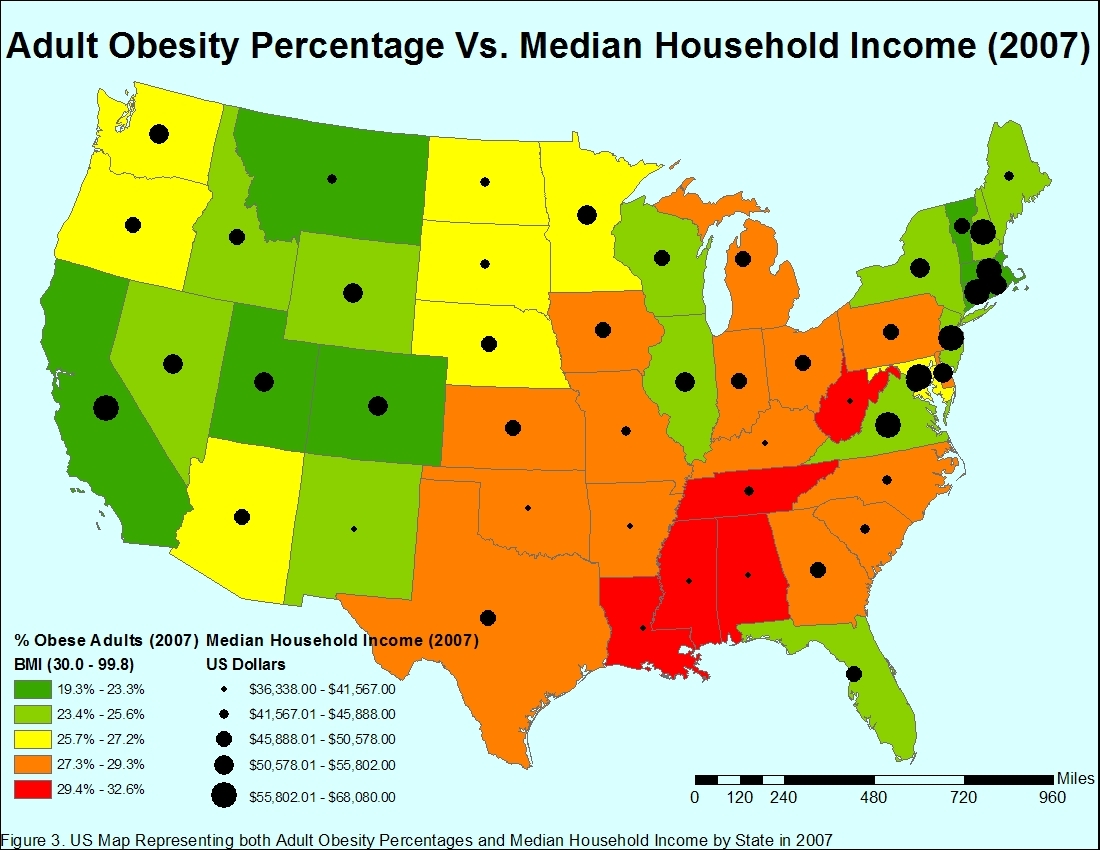
Southern states demonstrated a higher percentage of
adult
obesity than any other region in 2007. This report is an
examination of national income and education attainment level data, in
order to determine the significance of these variables to the South's
higher percentage of obese adults. Body Mass Index (BMI)
data,
provided by the Center for Disease Control, shows that nine of the ten
states with the highest percentages of adult obesity came from the
South. Mississippi had the highest percentage with
32.6%.
U.S. Census Bureau data showed that southern states comprised eight of
the ten lowest earning states in median household income in
2007.
Additionally, eight of the ten lowest states in high school (or
equivalent) completion percentages were from the South. In
conclusion, income and education attainment appear to be contributing
factors to the South's higher obesity rates. However,
research
incorporating additional factors such as age, gender, and ethnicity
would be more telling.
This report analyzes GIS data to correlate human
activities
with elevated nitrogen levels in the coastal waters of Casco Bay
located near Portland, Maine. There is a significant history
of
water quality data for Casco Bay from a multitude of sources, including
the Friends of Casco Bay. This research will use water
quality
data collected from monitoring sites throughout the Bay to make some
spatial comparisons based on land use and other significant human
impacts. It is expected that areas with large impervious
surfaces
and significant pollutant outfalls will have elevated levels of total
nitrogen. It is also expected that areas that receive waters
from
land uses that are high in nutrient inputs will also see elevated
levels of total nitrogen. These comparisons will be made
using
watershed data available to the researcher.
This paper explores whether environmental justice (EJ) disparities
exist among neighborhoods surrounding Superfund National Priority List
(NPL) sites, hazardous waste sites involved in the Resource
Conservation and Recovery Act (RCRA) corrective action program and
brownfields within Maryland (MD) and Washington, DC (DC). By
overlaying Environmental Protection Agency (EPA) toxic site data on
Census socioeconomic and racial data and using buffer zones to conduct
a proximity analysis in geographic information system (GIS) software, I
determined that while low-income populations are more likely to live
within high risk buffer zones surrounding toxic sites, minority
populations were not more likely to live in those areas.
Knowledge of spatial distribution of malaria is essential for designing
targeted interventions. This study looks at how climate
influences malaria in the highlands of Ethiopia. Specifically the study
tries to illustrate the effect of expected climate changes on epidemic
malaria in the highlands. The relationship of climate and altitude on
malaria distribution is examined. Epidemic malaria risk
developed from malaria modeling from the MARA/ARMA project is used to
show high and low risk areas. Scenarios of changes in
temperature and precipitation change are applied to predict risk.
Population distribution data is used to estimate at risk population due
to change in climate. Changes in temperature and precipitation are
associated with more areas falling in the high risk category.
A small change in temperature and precipitation in highland areas can
put a large population at risk of malaria. Focused
intervention effort should be directed towards malaria control
activities in highlands. |